Why every Nectabot shows its drawdown
The return tells you what a bot can do. The drawdown tells you whether you will still be running it. Here is how to read it.
Many EA sellers show a single equity curve that only goes up, or a screenshot of their best month. It looks good, and it tells you almost nothing about whether you can actually live with the bot.
The number that tells you that is the drawdown. It is a number we put next to the return, never below it, and this article explains why.
What drawdown means
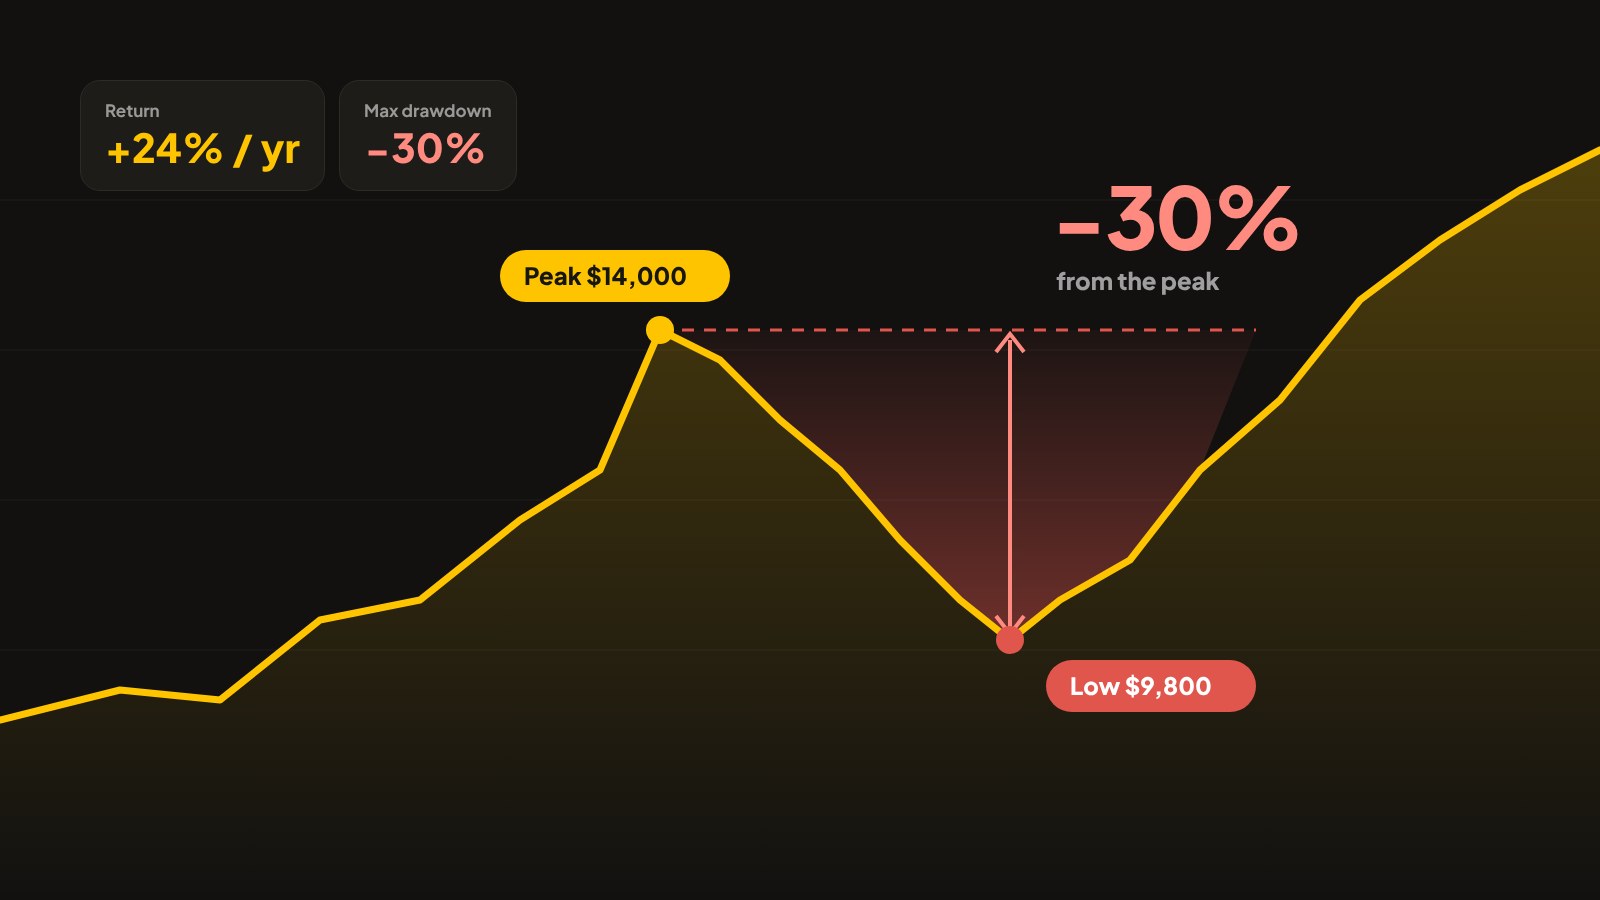
Drawdown is how far an account falls from its highest point before it recovers. If an account grows from $10,000 to $14,000 and then falls to $9,800, the drawdown is $4,200, or 30% from the peak.
The maximum drawdown is the deepest of those falls over the whole test period. It is the worst stretch the strategy went through.
Why it matters more than the return
A bot that makes 40% a year but falls 35% along the way is a very different experience from a bot that makes 20% a year and never falls more than 10%. On paper the first one wins. In practice most traders switch the first one off at the bottom of the fall, lock in the loss and never see the recovery.
The return tells you what the strategy can do. The drawdown tells you whether you will still be running it when it does.
The maths of getting back
Losses and gains are not symmetrical. The deeper the fall, the bigger the gain needed just to get back to where you were:
- After a 10% drawdown you need about 11% to recover.
- After a 30% drawdown you need about 43%.
- After a 50% drawdown you need 100%, a doubling of the account.
This is why a strategy with a moderate return and a shallow drawdown often ends up ahead of a strategy with a high return and a deep one.
What we publish with every bot
When we publish a bot's backtest, the maximum drawdown sits right next to the return, and every month of the test is included, not just the good ones. Each report comes with:
- The return, with the period it covers.
- The maximum drawdown over that period.
- The settings and risk level used to get it.
We also say plainly what kind of strategy each bot is. A grid bot behaves differently from a breakout bot with a hard stop, and you should know which one you are running before you switch it on.
How to use the drawdown when you choose your risk
Most Nectabot bots let you set the risk level. The drawdown scales roughly with it: double the risk and you can expect roughly double the drawdown. Use that to choose a setting:
- Decide the largest fall you could sit through without switching the bot off. Be honest.
- Look at the bot's maximum drawdown at its default setting.
- Lower the risk until the expected drawdown sits inside your limit, with room to spare.
What a backtest cannot tell you
A backtest is a simulation of the past. Live results will differ, sometimes a lot, because of your broker's spread, execution speed, swaps and conditions the test period did not contain. The future can always produce a worse drawdown than the past. Treat the published figure as a minimum to plan for, not a ceiling.
That is also why every Nectabot bot ships with risk settings you control, and why we suggest running it on a demo account first, on your own broker, before trading it live.